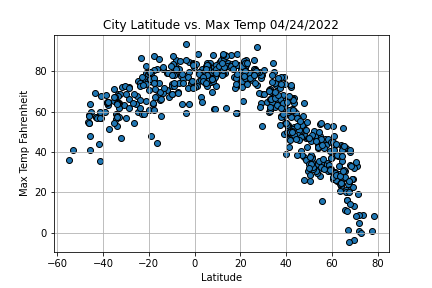
Max Temperature Versus Latitude
When observing this scatter plot, 0 represents the equator. The closer to the equator the higher the higher the Max Temperatures were. The cities located closer to the North Pole (80 degrees), had temperatures below 40 degrees fahrenheit.
Last updated 04/24/2022